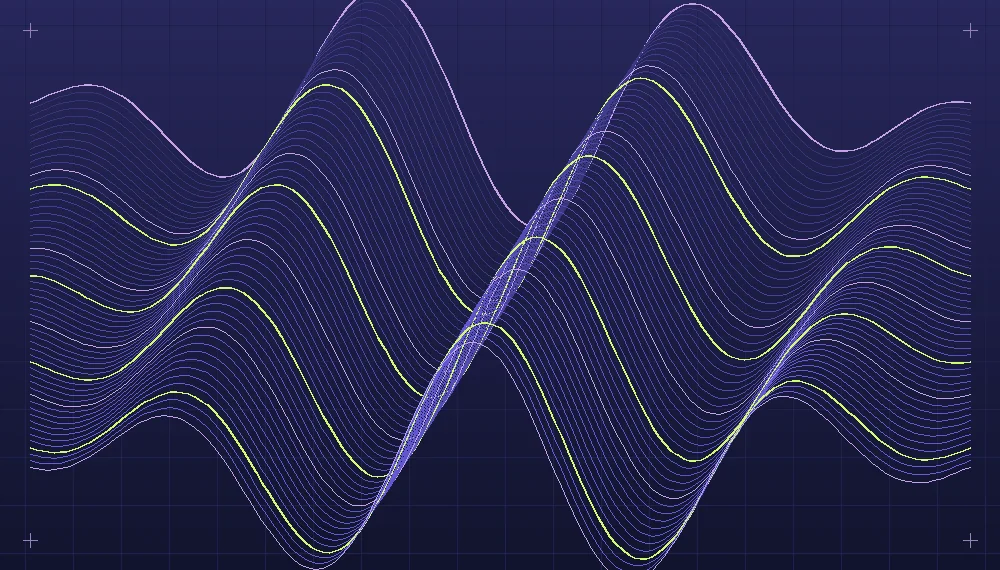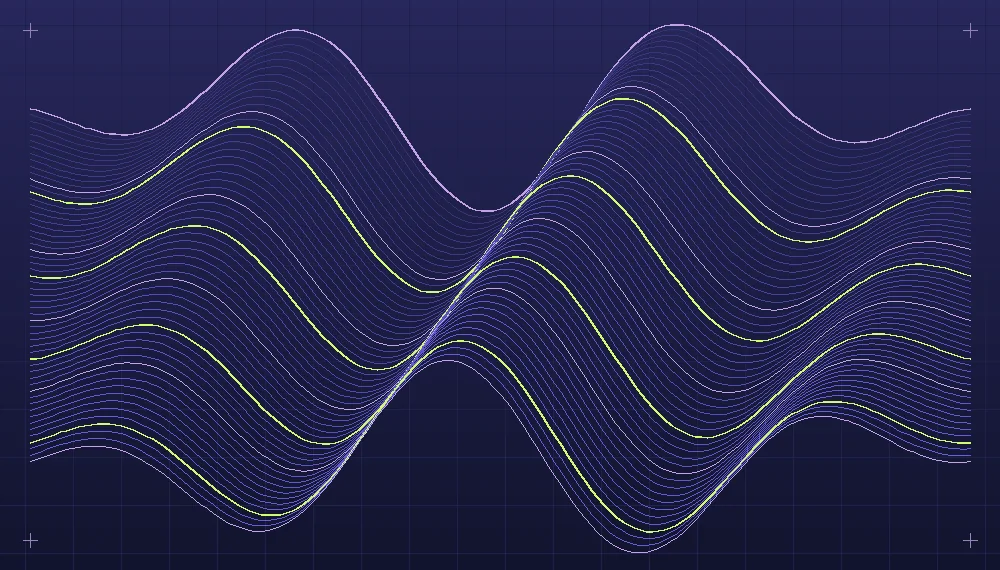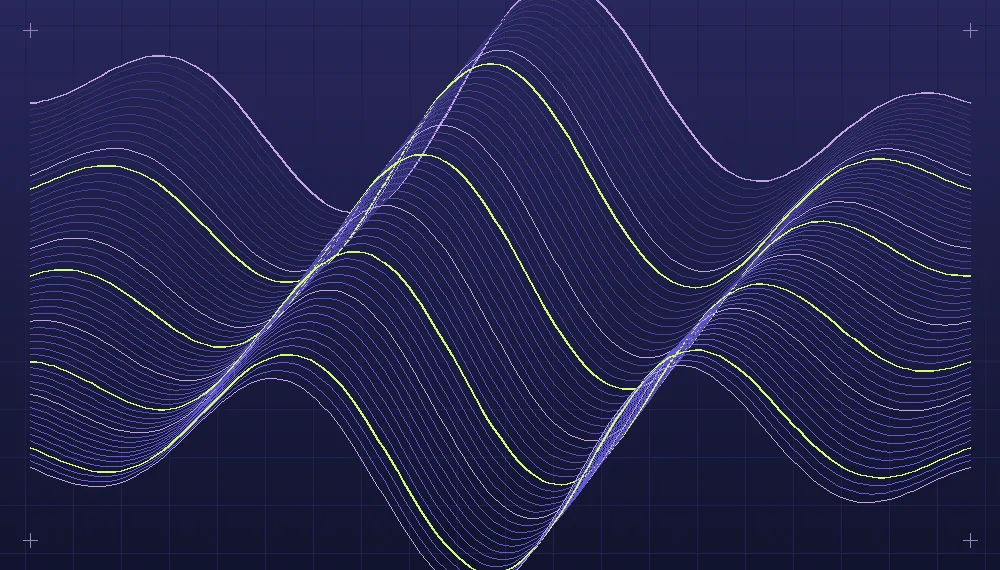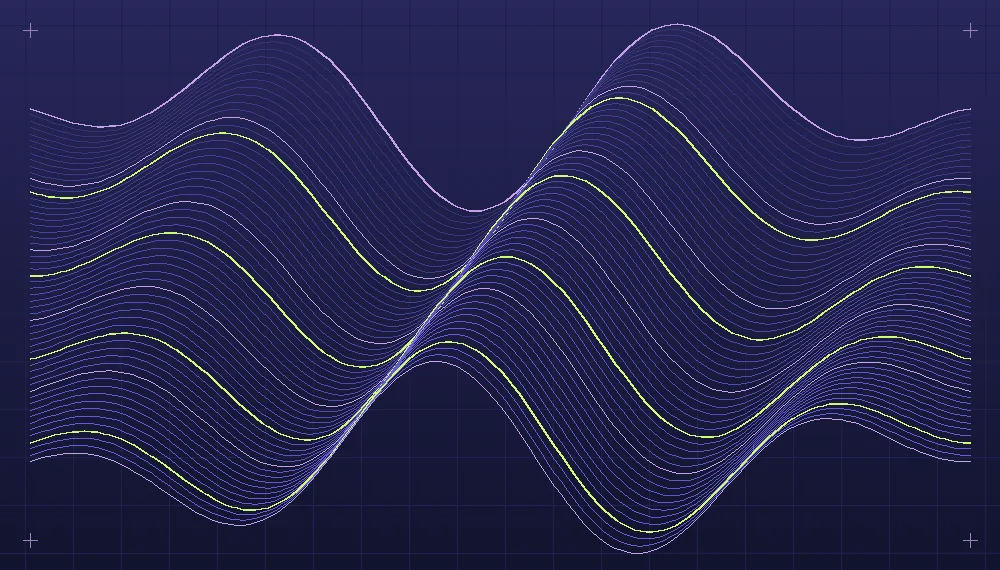
An equation can describe a beautiful path without producing a compelling picture. The difference is familiar to anyone who has plotted an interesting function, admired its complexity and then wondered why the resulting image feels flat. A mathematical construction supplies relationships between positions. Graphic composition adds decisions about framing, hierarchy, the density of marks and the way those relationships are encountered by a viewer. Creative coding becomes a visual practice when these decisions are treated as part of the work rather than incidental presentation choices made after calculation.
Look at the characteristic movement first
Consider a parametric curve whose horizontal and vertical coordinates each vary as a sine function of a parameter. Frequencies, phases and amplitudes produce paths that can fold, cross and repeat. Begin by rendering one uncomplicated version on a plain canvas. Trace its movement with your eye: notice where it turns sharply, where paths converge and where space opens between loops. Those features might matter more than the equation's apparent symmetry. At this stage, avoid surrounding the curve with many other unrelated shapes. The initial goal is to identify its visual character.
The pace at which a parameter changes affects how points are distributed when the curve is sampled. A uniform step in the parameter does not guarantee a uniform distance between adjacent positions in space. If points are used as visible marks, dense sections can appear darker simply because the motion is slow there. If the path is rendered as connected segments, abrupt changes may need closer sampling to preserve smoothness. Decide whether the uneven distribution is a desirable trace of the rule or an artifact to correct. Sampling is a technical choice with a visible consequence.
Treat the canvas as a movable frame
A conventional plot centers its coordinates and sets bounds so that the whole construction fits. This makes it easy to inspect the mathematical object, but a finished graphic can have a different priority. Try magnifying a region of the path rather than displaying all its loops at once. The enlarged portion might reveal a rhythm that was lost in the smaller complete figure. A crop positioned away from the center can create a quieter region next to a concentrated group of intersections. Compare a centered view with one shifted toward the densest area.
The choice of aspect ratio changes how the viewer reads a path. A wide rectangle encourages lateral movement, while a tall frame can emphasize a rising or falling form. If the coordinates are mapped separately to the full width and height, the geometry itself will be stretched. If the original proportions are preserved, empty space around the drawing can increase. Neither option is universally correct, but avoid switching between them without noticing. For a series made from variations of a single curve, retaining one mapping rule often helps distinguish real changes in the equation from changes in presentation.
Related reading: Generative lines as a visual language.
Leave some room around an important bend when that detail is intended to hold attention. Elsewhere, allow a secondary segment to extend beyond the frame if the construction should appear to continue out of sight. Draw several alternative crop boxes over a larger reference rendering. The boxes let you inspect what each framing decision includes and excludes without committing to new versions of the curve. Export them at the same visual dimensions for comparison. An effective crop is not necessarily the one containing the most intersections.
Use line weight and intervals to build hierarchy
Imagine a family of related curves generated by gradually changing one frequency or phase value. When every path uses the same heavy stroke, their overlaps can produce a dark mass whose internal structure is barely visible. A thin structural weight may reveal the relationship between neighboring paths. Select one or two paths for a stronger weight if they clarify the movement of the family. Their distinction should help the viewer see the structure, not simply decorate an arbitrary index. A contrast in weight can be useful even before any differences in color are introduced.
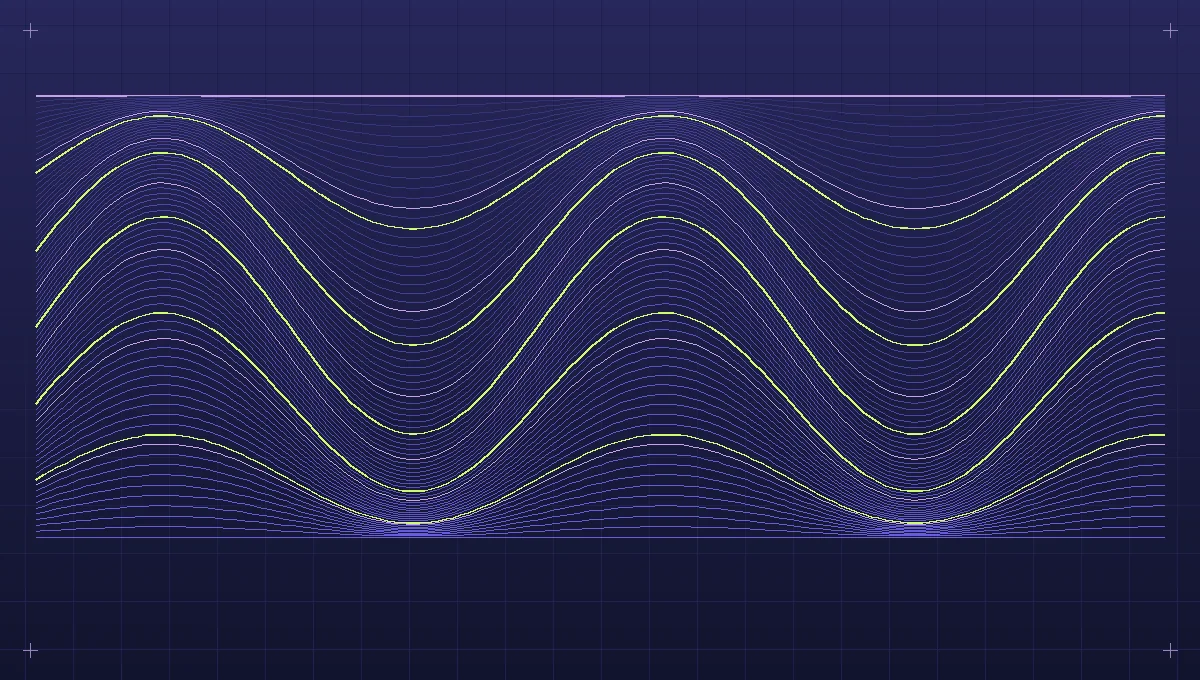
Spacing has a similar effect. A few well-separated paths allow each trajectory to be read individually. A dense field begins to behave like texture, especially when viewed at a small size. To create a transition between those effects, vary the intervals between parameter values. For example, generate many paths near a particular parameter and fewer toward its extremes. That decision changes the visual density without changing the shape of the individual mathematical function. Inspect where the resulting paths concentrate in image space, since equal differences in the parameter may produce unequal geometric differences.
A composition study in four exports
Start with a square rendering of one path whose loops cross near the middle. Keep the palette simple: a dark background and a pale stroke. Export it as a reference. In a second version, move the view so that the central crossing sits near a lower corner and the outer loops occupy part of a wider canvas. The original object is unchanged, but the direction of attention is different. The second export should help establish whether the complete symmetrical version or the fragment offers a more interesting spatial relationship.
For the third study, draw a small number of neighboring curves by introducing a slight shift in phase. Render them with a lower weight than the original. Look for repeated spaces and unexpected knots. If their paths interfere with the strongest part of the first figure, either reduce their number or choose a parameter interval that changes the relationships more gradually. In the fourth version, keep the successful set of curves and add one accent tone to the path that best supports the movement. Avoid changing the crop at the same time: otherwise it is not clear which decision improved the composition.
Set all four previews on the same blank surface and reduce them to thumbnail size. Look at the overall shape before examining individual mathematical details. Does the drawing feel balanced or suspended awkwardly? Is there a region that attracts attention without requiring a caption? Does the cropping seem intentional? Then enlarge the images and inspect path smoothness, consistency of joins and how the lighter secondary strokes meet the more prominent line. The two scales serve different purposes and should be judged separately.
Clear intersections often depend on the order in which paths are drawn. Try placing the primary curve last so it remains uninterrupted above secondary lines, then compare an arrangement in which translucent overlaps are allowed to accumulate naturally. The ordering can change which trajectory the viewer notices first.
Retain the relationship between calculation and artwork
The mathematical rule can remain visible even in a highly edited composition. A partial curve may reveal its periodic character through repeated turns, and a selected family of paths can demonstrate how one small parameter change alters a whole structure. The aim is not to disguise the equation by adding graphic effects. It is to choose which aspects of the equation deserve attention. A single figure with a clear rhythm can communicate mathematics more effectively than an elaborate layering of unrelated constructions.
Save the base parameters separately from the presentation decisions. Include the coordinate transform, crop, sampling resolution and visual weights alongside the mathematical function itself. If you revisit the piece to build a larger series, you can then experiment with the geometry while preserving the graphic treatment, or explore a new frame while retaining the same path. This method creates a useful conversation between computation and judgment: the algorithm produces an object with many possible readings, and successive compositional studies reveal which readings are worth developing.
Explore the implementation area: Artificial art and generative design.